Data Quality Monitoring
Overview
The Data Quality Monitoring project I led has introduced the data management concept to FullStory users. Our goal was to increase users' trust in the data powering dashboards and metrics, which guide critical business decisions for all customers. Furthermore, the absence of a solution to efficiently manage data was most acutely felt across the enterprise customer base, where an increasing number of users across multiple business teams were generating data without a way to efficiently find and fix quality issues. This resulted in an exponential increase in quality issues over time within the highest revenue-generating customer segment.
Background
FullStory is a B2B digital product analytics platform used by over 3000 e-commerce and SaaS companies to enhance the user experience of their websites and mobile applications, making them more lovable, valuable, and usable.
In the increasingly competitive market of product analytics in the SaaS industry, where customers adopt strategies to centralize tools within their operations and aggressively optimize their spending, maximizing customer retention and loyalty is critical for business survival. The project in this case study is part of a new data strategy aimed at increasing customer value through greater adoption of the premium analytics feature set within the FullStory product.
Research
At the beginning of the project, I joined the brand new product team, so it was crucial to establish a deep understanding of the broader problem space within the uncharted product area. While the Data Quality Monitoring project addressed the highest-scoring opportunity we identified, the greater discovery work we completed became a foundation for the longer-term roadmap of the newly established team.
Market research
Based on competitive research, it was identified that all competitors partially addressed the problem. However, our key competitor, with whom we directly compete in deal cycles, offered a solution that, while not the most intuitive, provided a comprehensive end-to-end user flow.
Research on industry trends validated that data quality is essential for the success of product analytics implementation across all industries. Furthermore, achieving data quality typically involves a centralized data governance model. However, teams responsible for data governance often create bottlenecks and find the process time-consuming and tedious. Therefore, the ideal future is an automated decentralized data governance model.
Data analytics
By categorizing feedback and identifying themes from both Salesforce and Gong, we discovered lost deals to the key competitor and explicit mentions of how frustrated customers were with the lack of visibility and context around the data they created.
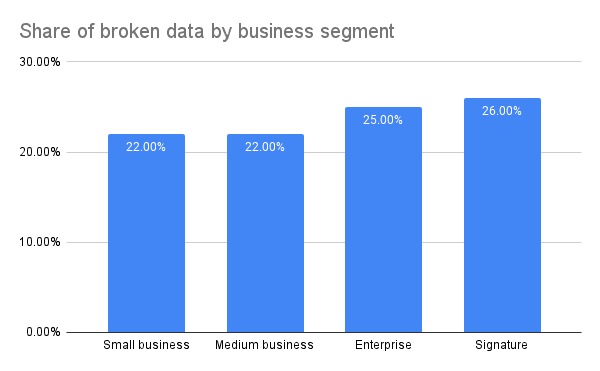
Additional analysis of the data configuration across customers' environments using BigQuery and Looker reports revealed 22%-26% of data was broken, with the % increasing proportionally to the size of the organization. This further validated our hypothesis around the significant impact on the enterprise business segment.
Stakeholder interviews
Internal interviews with sales engineers, solution architects, enablement, and support teams revealed that existing process of data cleanup, provided to a small segment of selected customers, is inefficient and often experienced as "a black box." This process required manual validation and time-consuming tracking in spreadsheets.
Customer interviews
Problem space
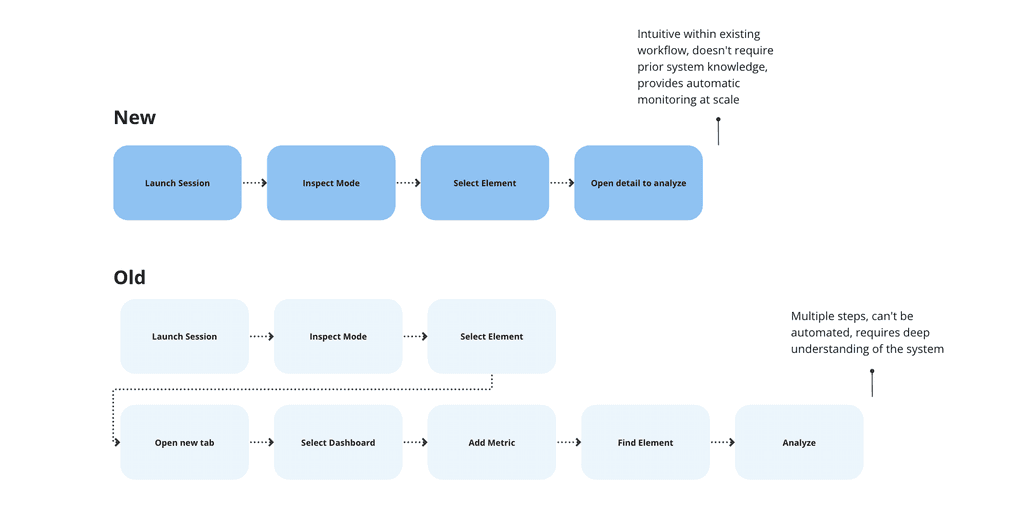
Semi-structured interviews with top users who create data revealed that many were unaware that data could break, while some had implemented workarounds by manually creating dashboards to track data quality. We validated that data quality is crucial to our users. Implementing issue monitoring will increase trust, cutting the workaround workflow by half. It will also provide additional value with automatic monitoring of all data at scale.
Solution space
In the solution space stage, we conducted rapid usability testing and ran experiments on various iterations of the product.
Initially, we discovered that monitoring data at scale from the Settings page provides a natural starting point for relevant user roles, without overwhelming all users of the application. This also gives time for relevant user roles to address issues at the beginning, given the high volume of historically accumulated data quality issues.
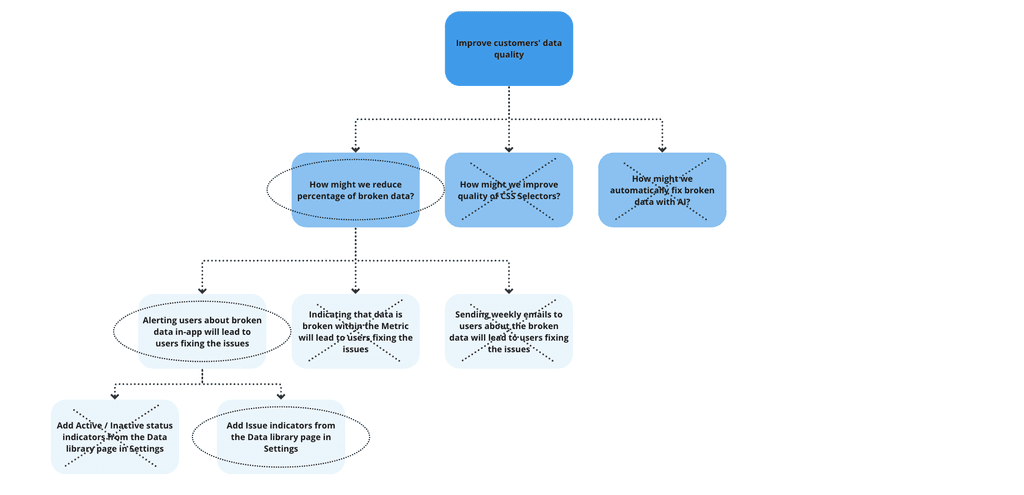
Then, we shifted away from the concept of active/inactive status to focus on issues, finding a more scalable solution that will support multiple issue types in the future. This approach also allowed for a less deterministic handling of issues, considering their complex nature.
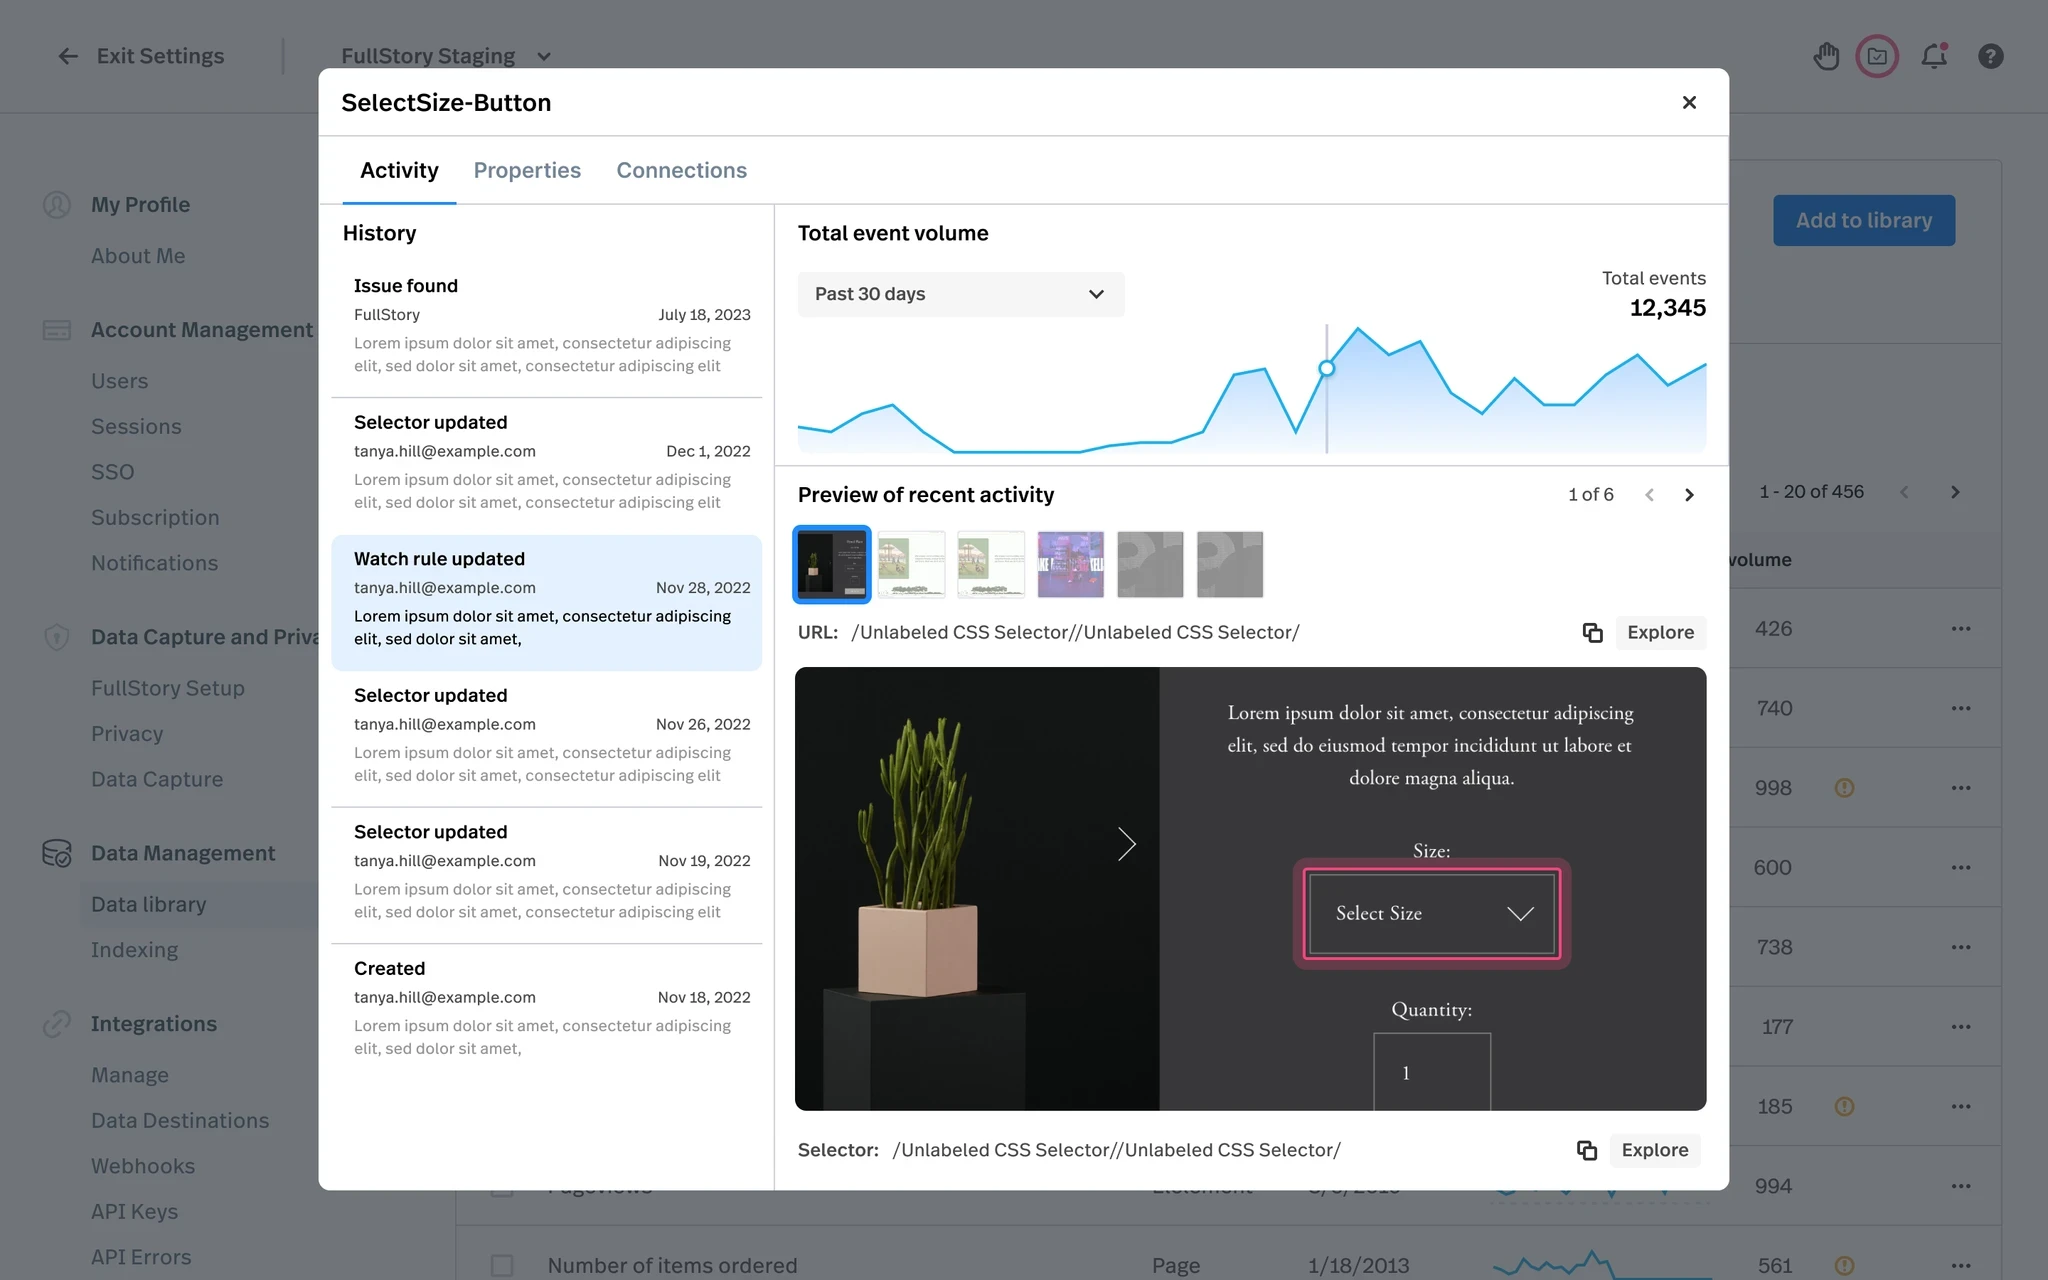
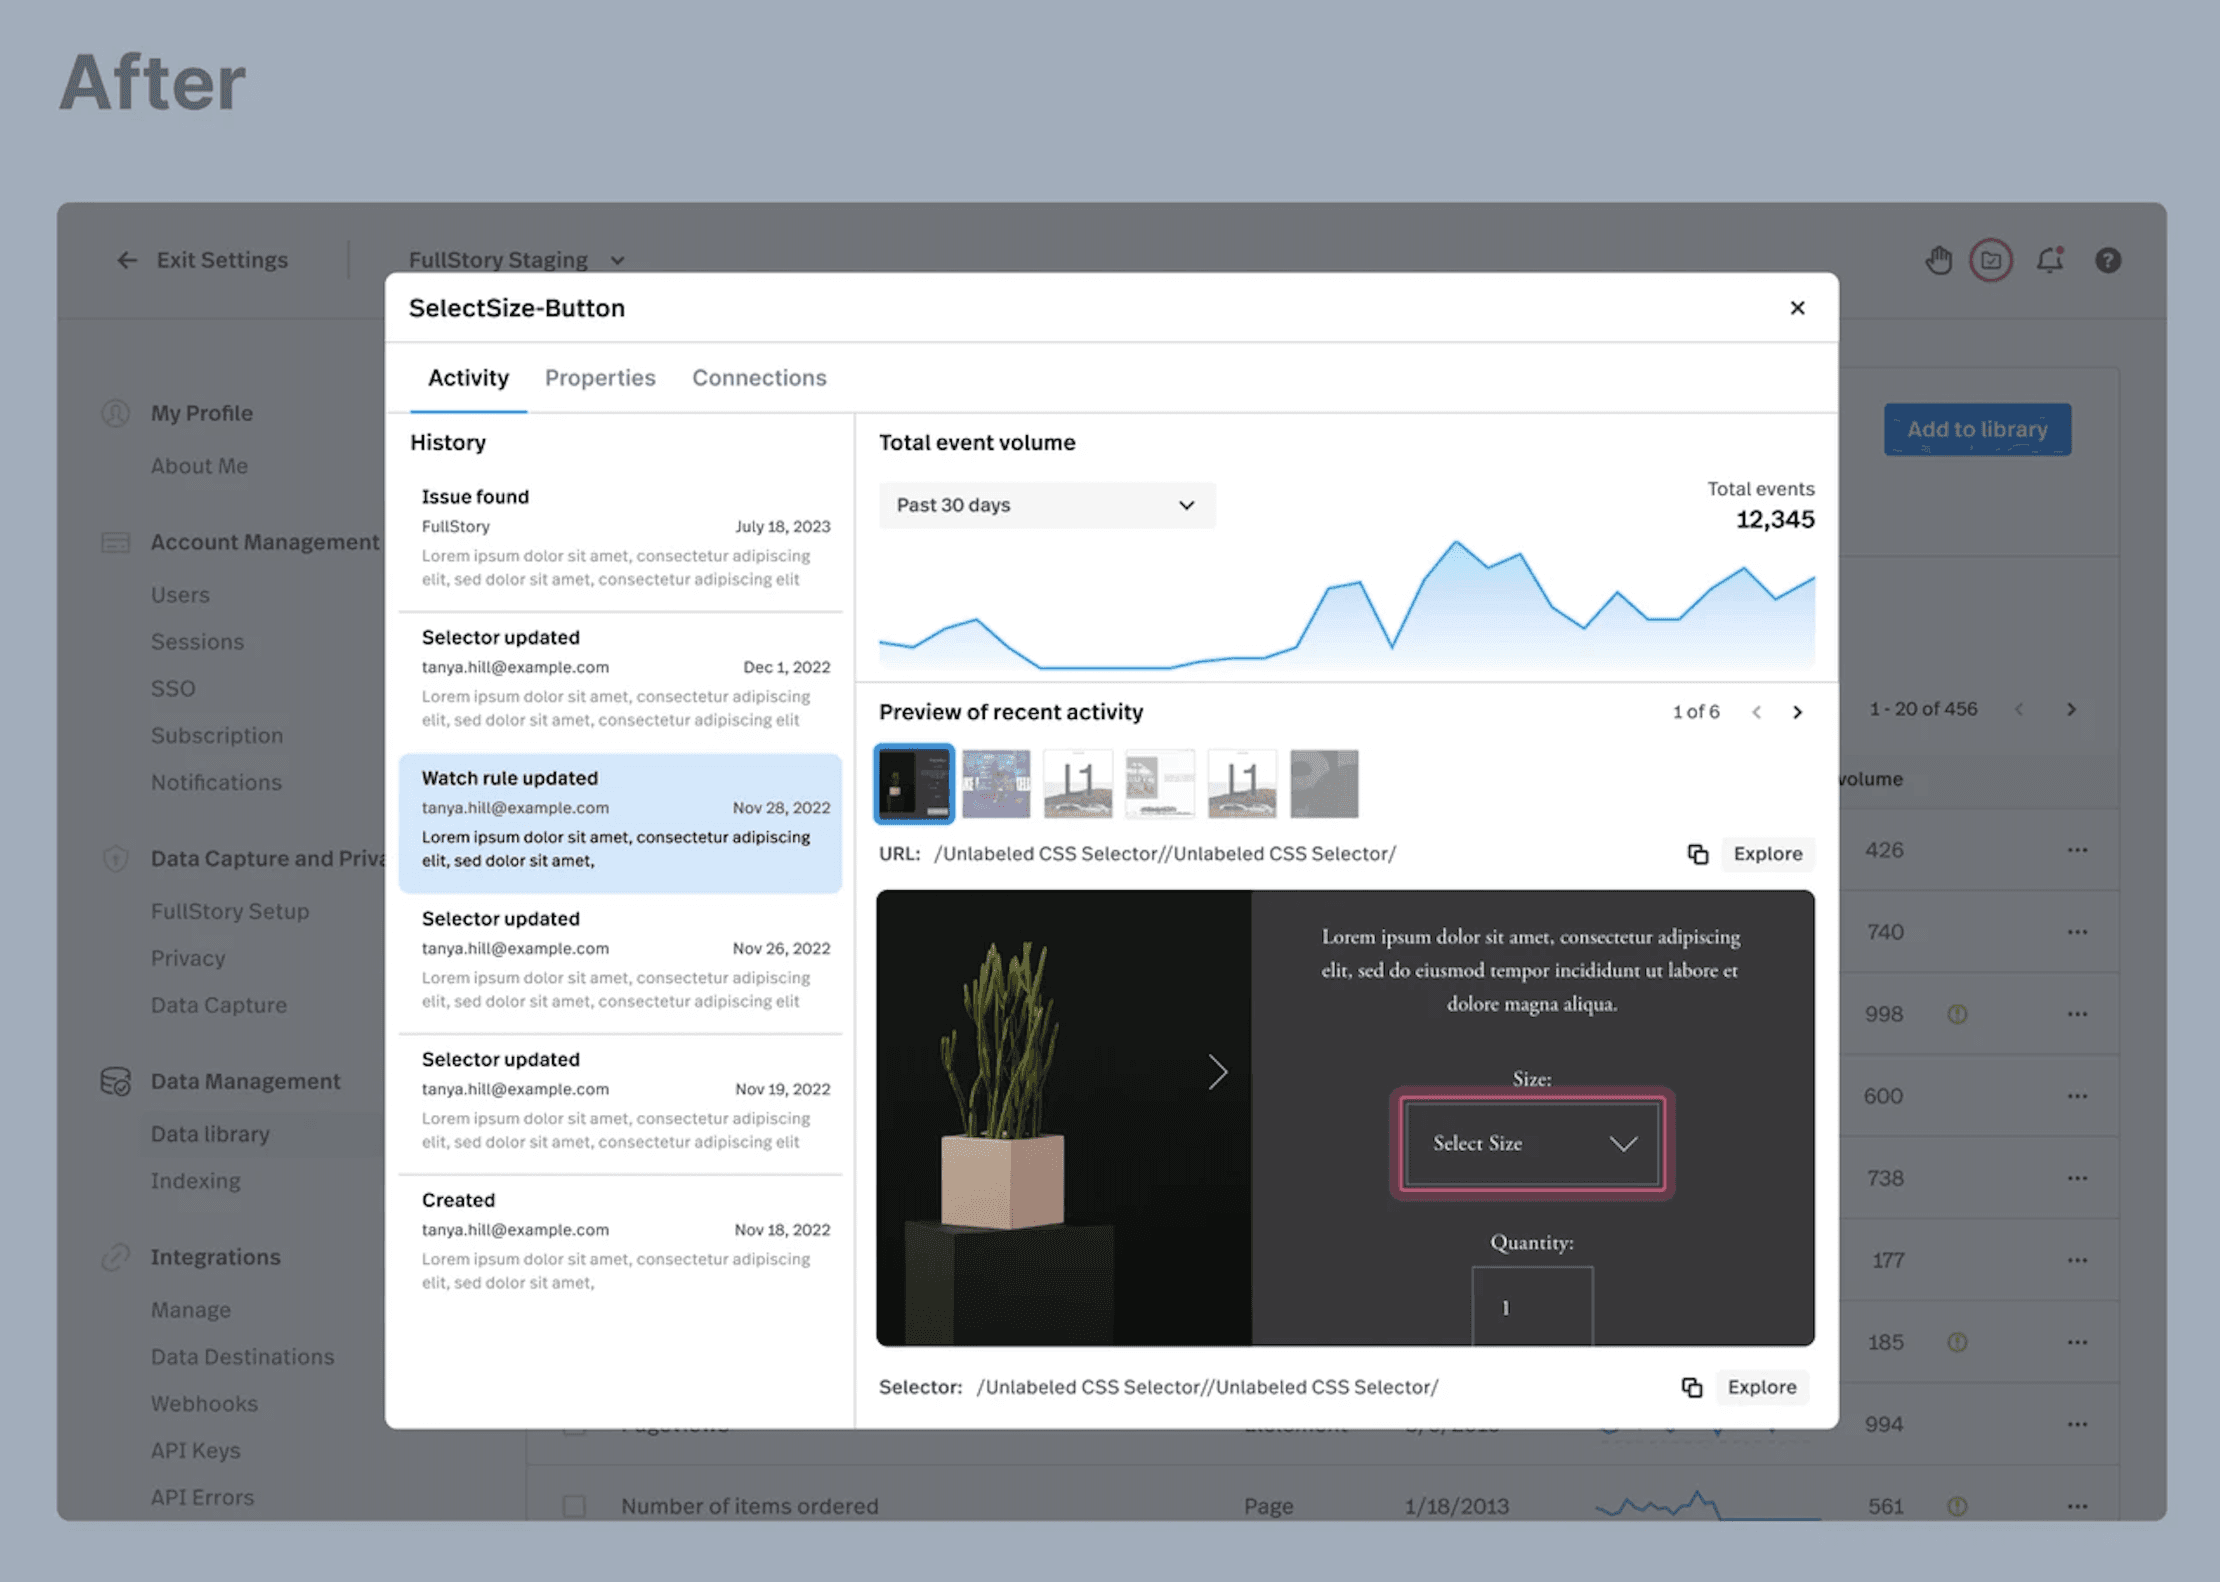
Eventually, based on customer feedback, we improved the discoverability of the new Activity tab, optimized filters to efficiently manage a list of all issues, and prioritized critical data context for our users. All of these learnings influenced the scope of the first iteration and shaped further improvements, such as change history and references. Determining the necessary constellation of context required for improving algorithms for automatic cleanup suggestions brought us closer to the future vision of AI-assisted data governance.
Findings
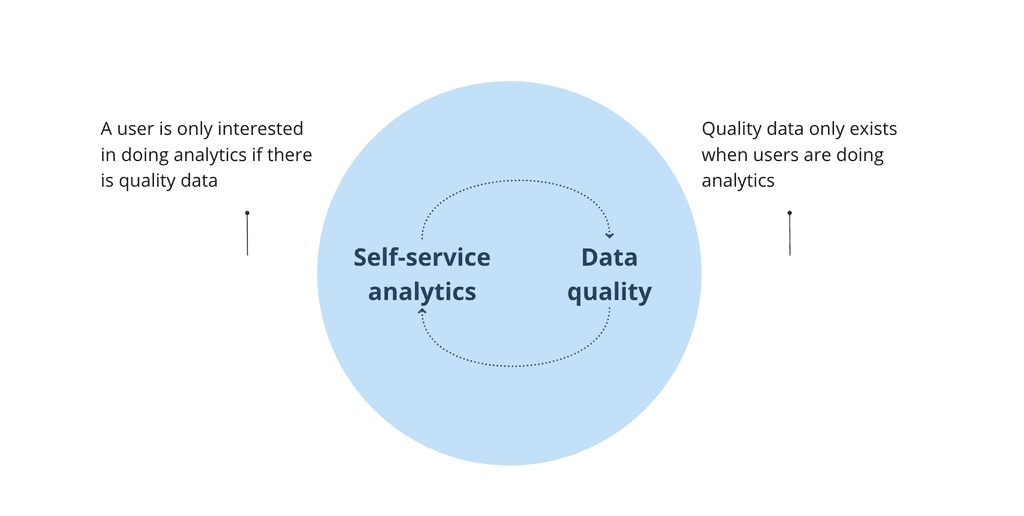
Throughout the discovery process, we uncovered the users' struggle to find reliable CSS Selectors, which was the second major reason leading to poor data quality. With both problems being critical root causes, it was challenging to prioritize the starting point. We allocated 80% of our resources to data quality monitoring, considering the time investment users' had already made. This decision was guided by the principle that analytics success starts with knowing what is wrong with existing data. Fundamentally, users have less motivation to invest time in creating quality data if there is no tool to maintain it over time, considering its dynamic nature. This approach also allowed us to save time spent by internal teams governing data of largest customers. The remaining 20% of time was spent on critical improvements to address the second major reason leading to poor data quality.
Solution
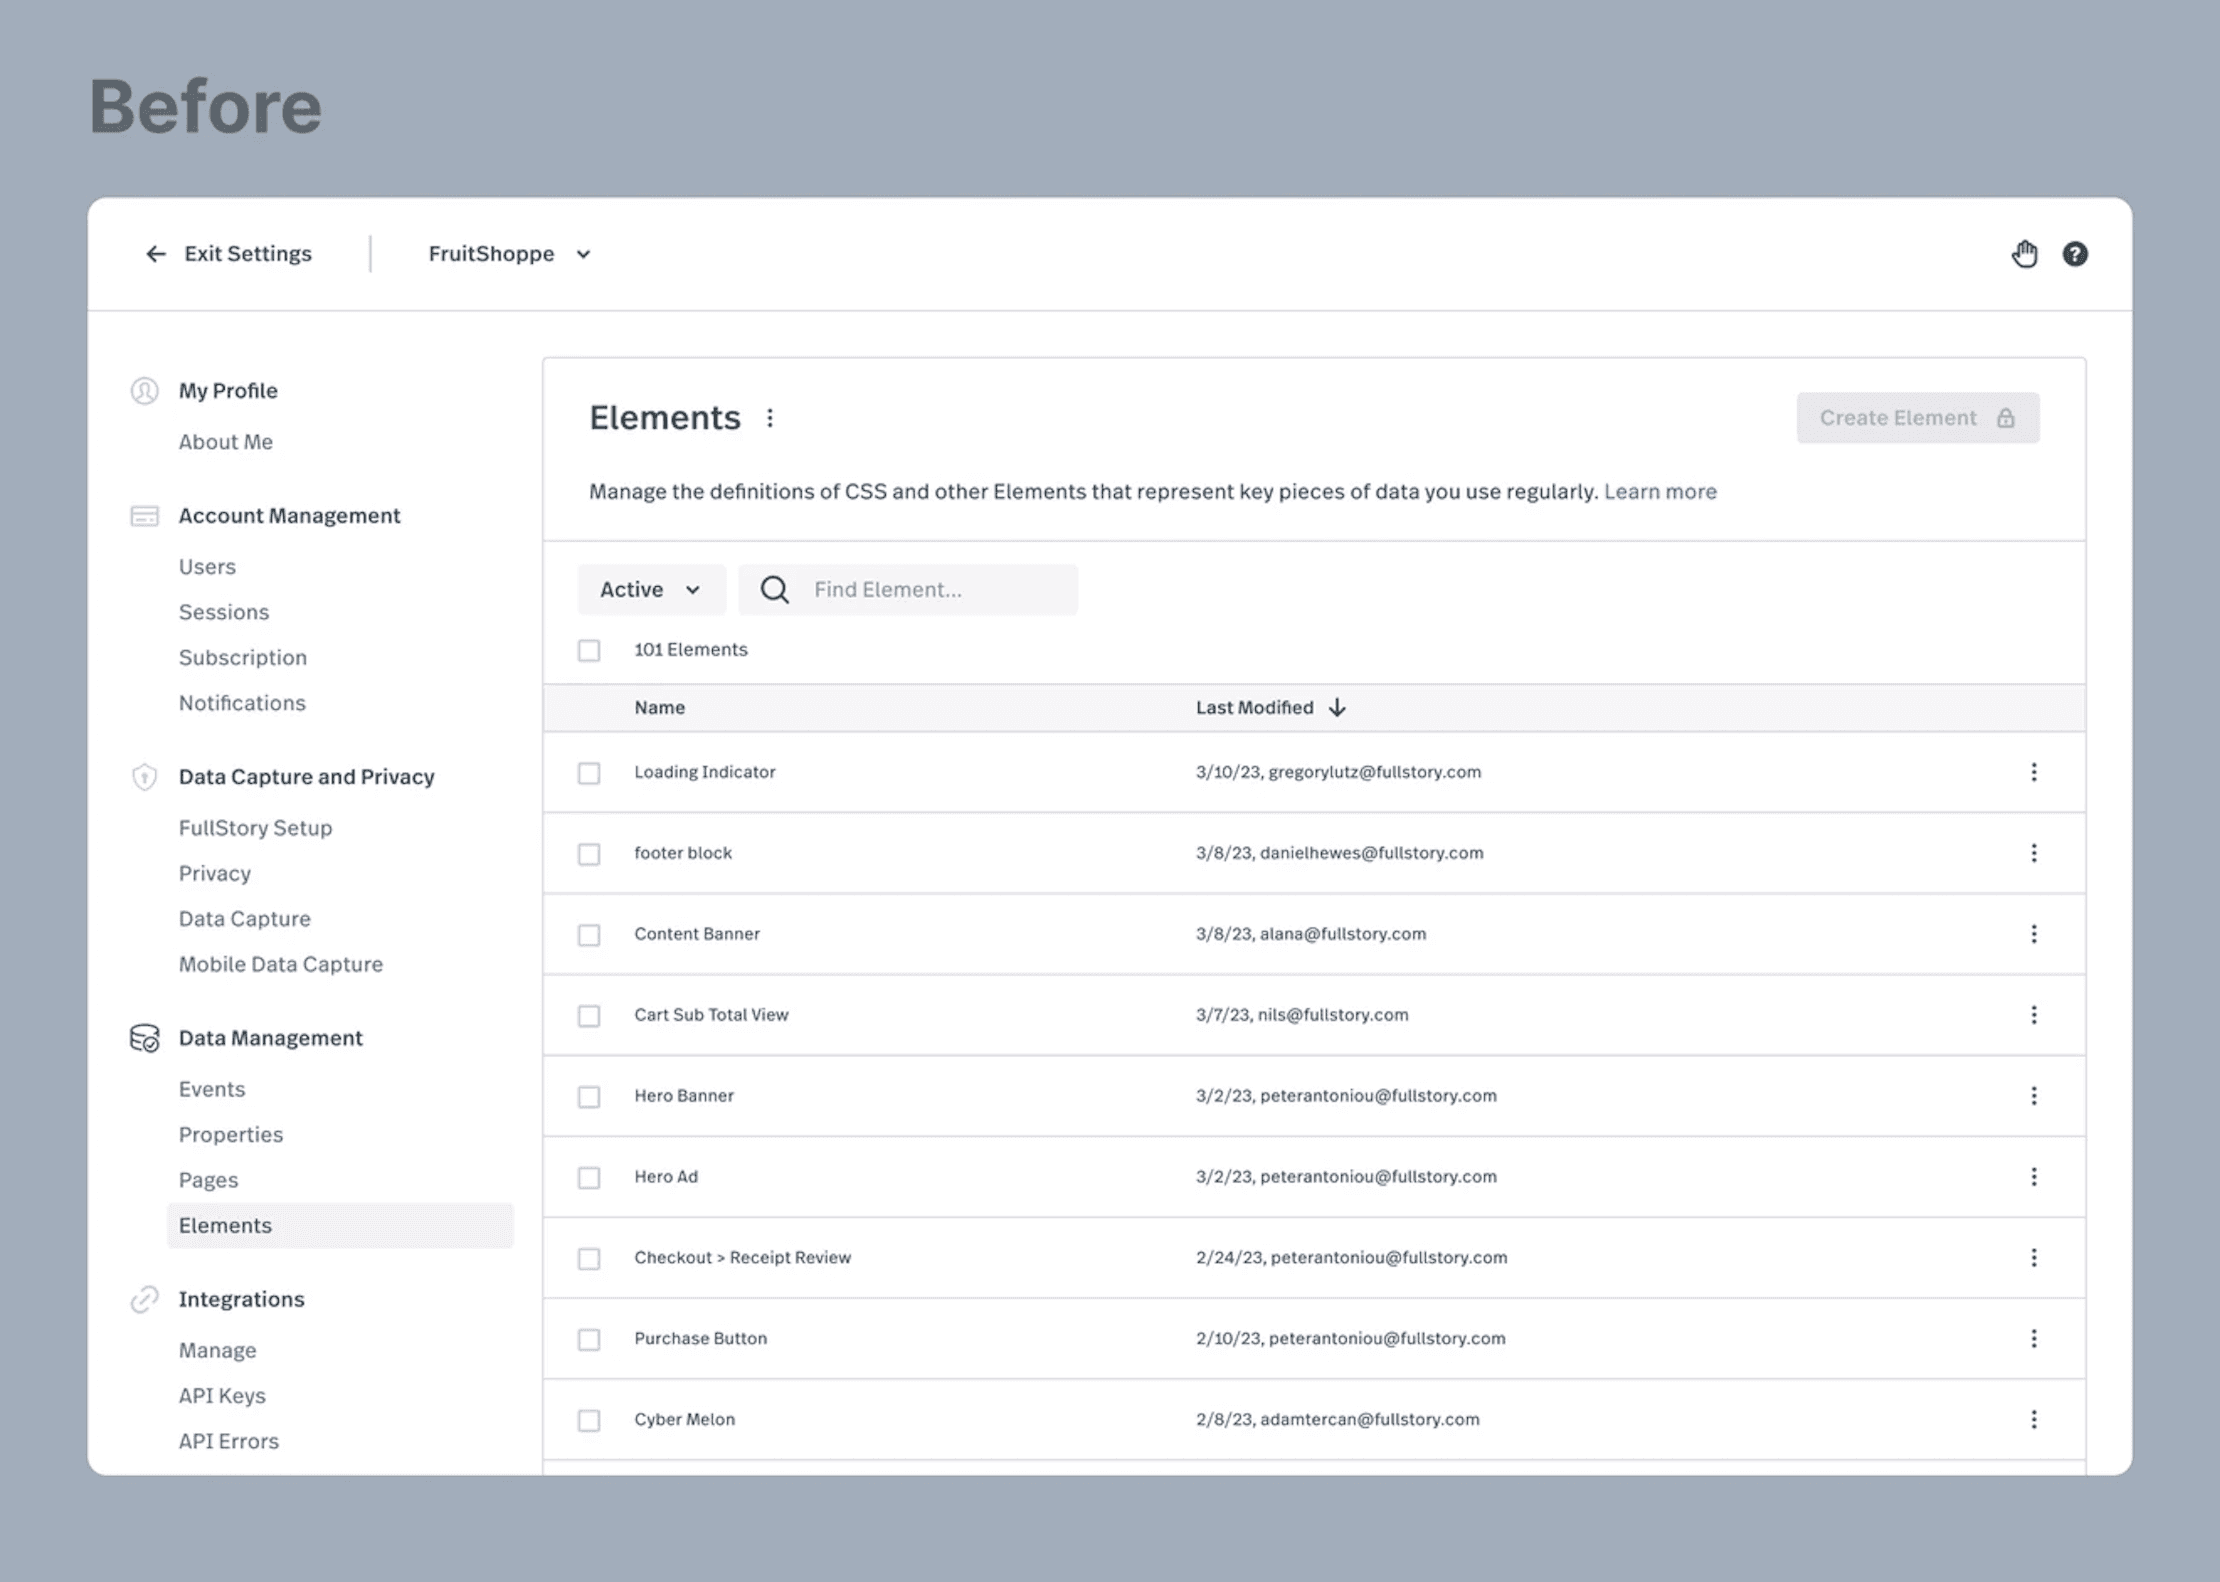
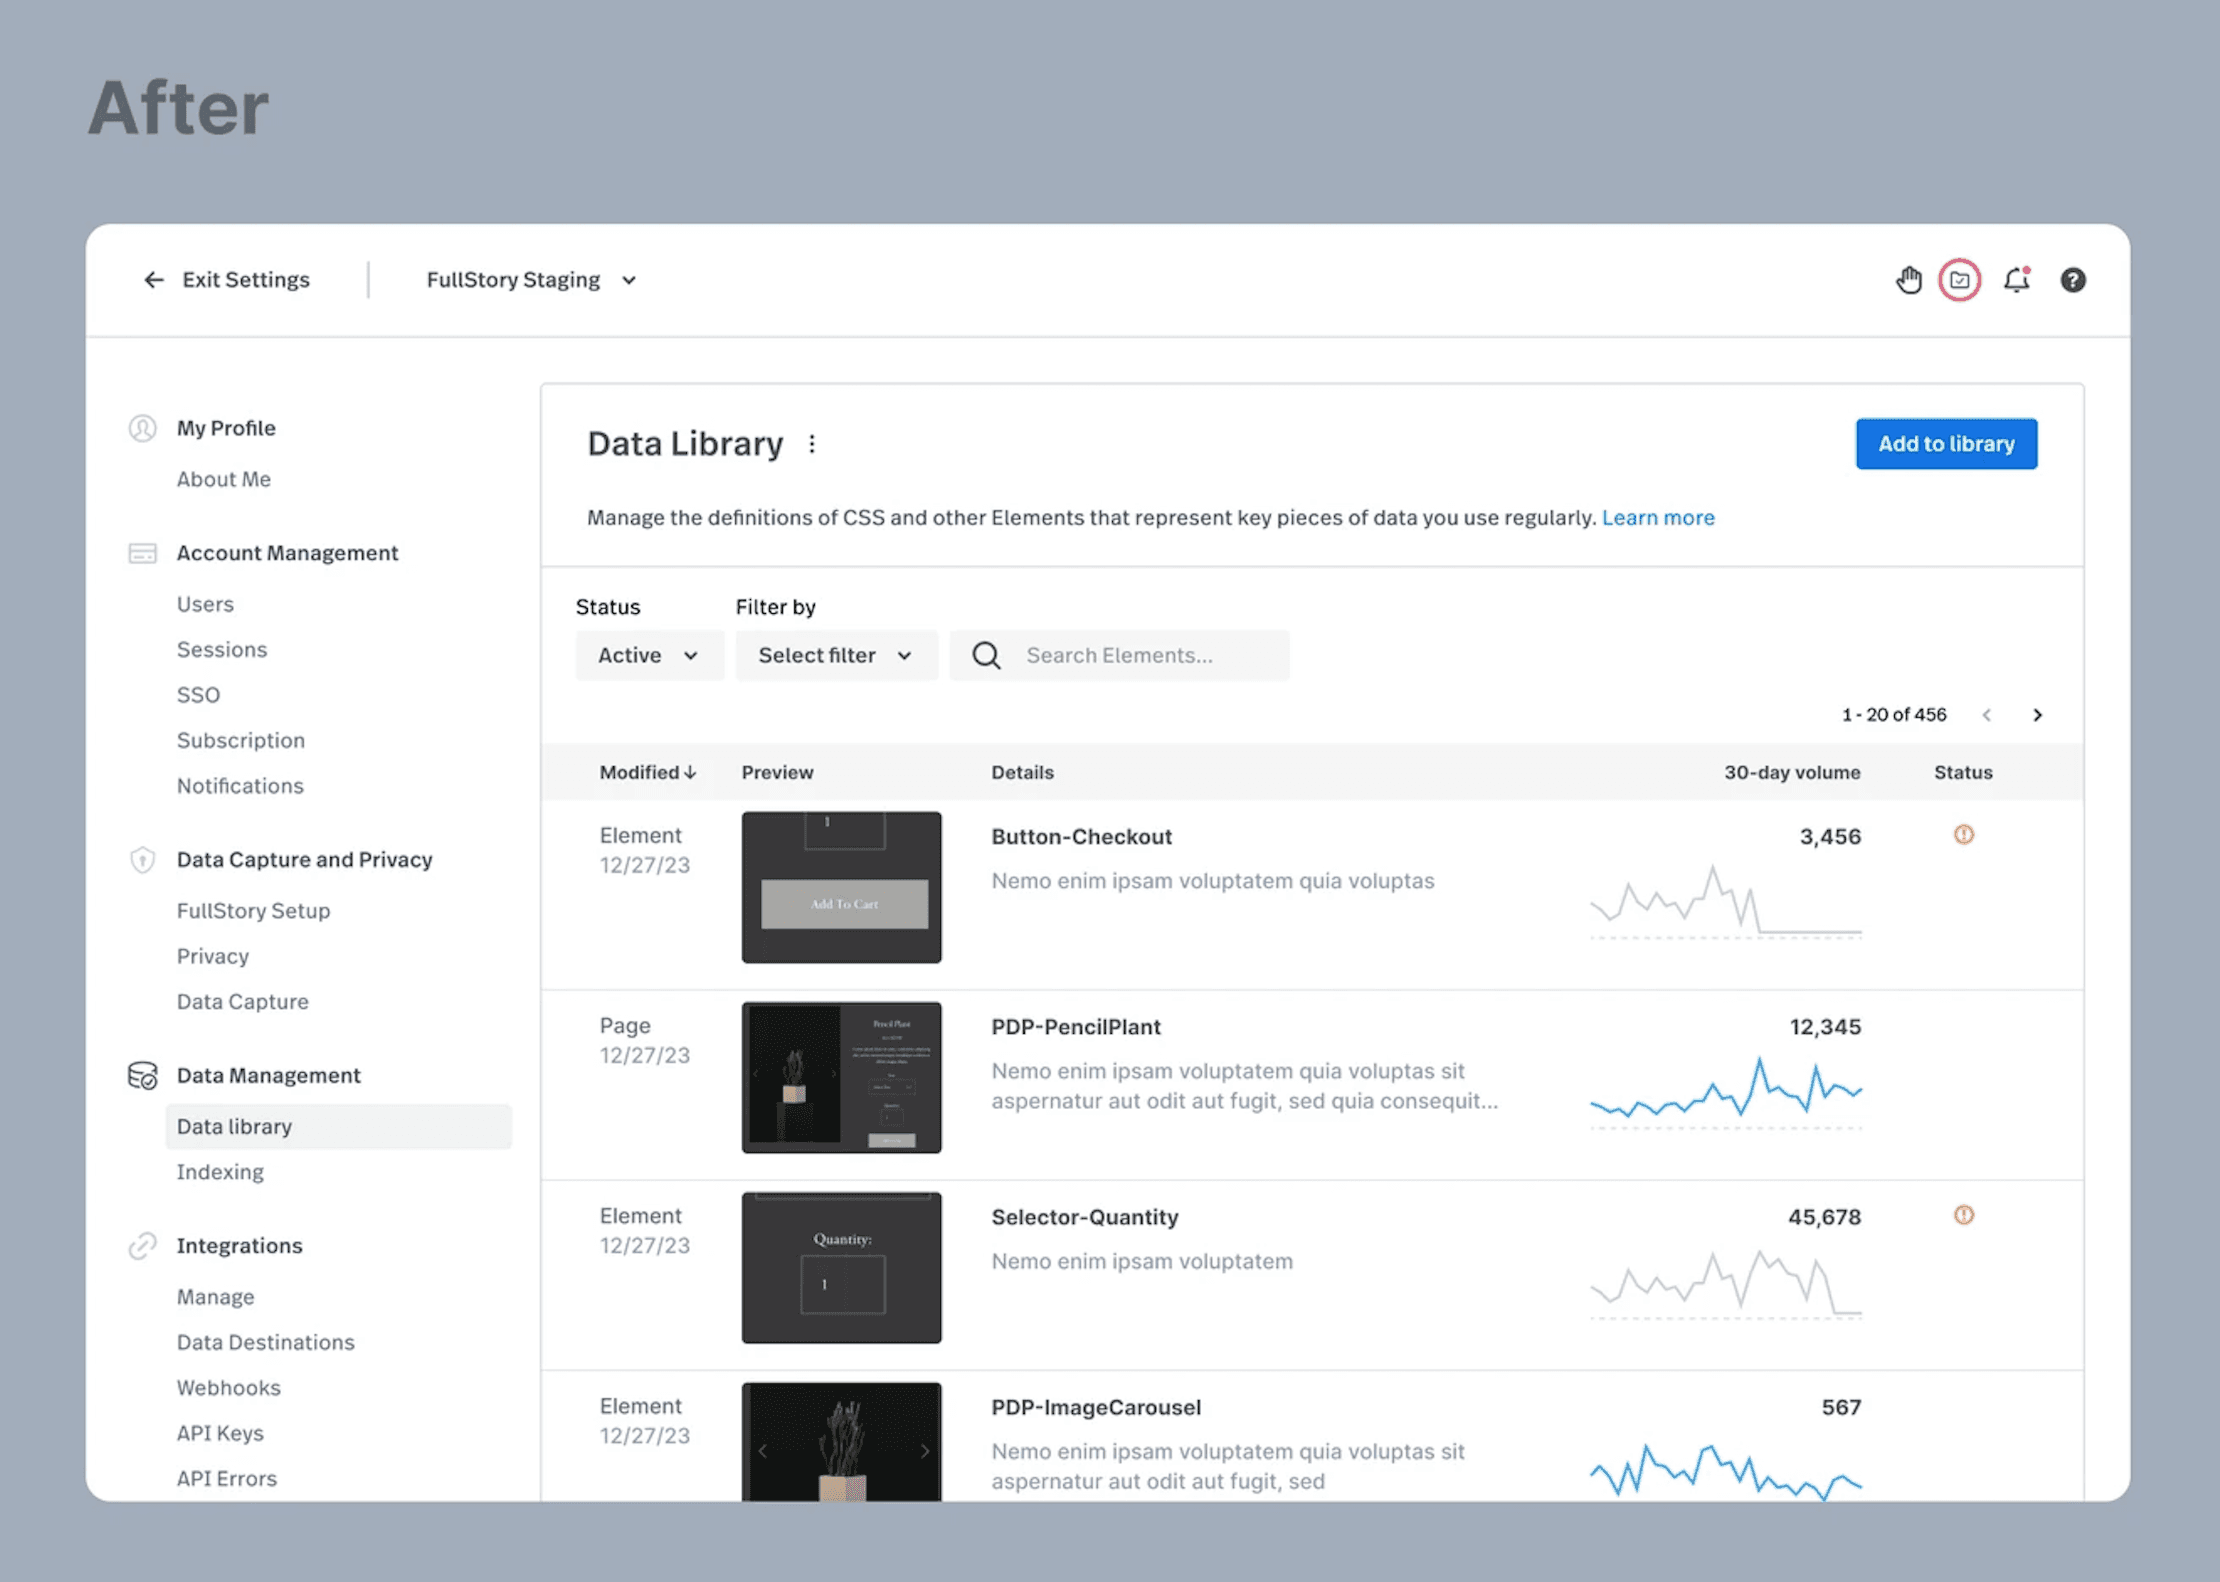
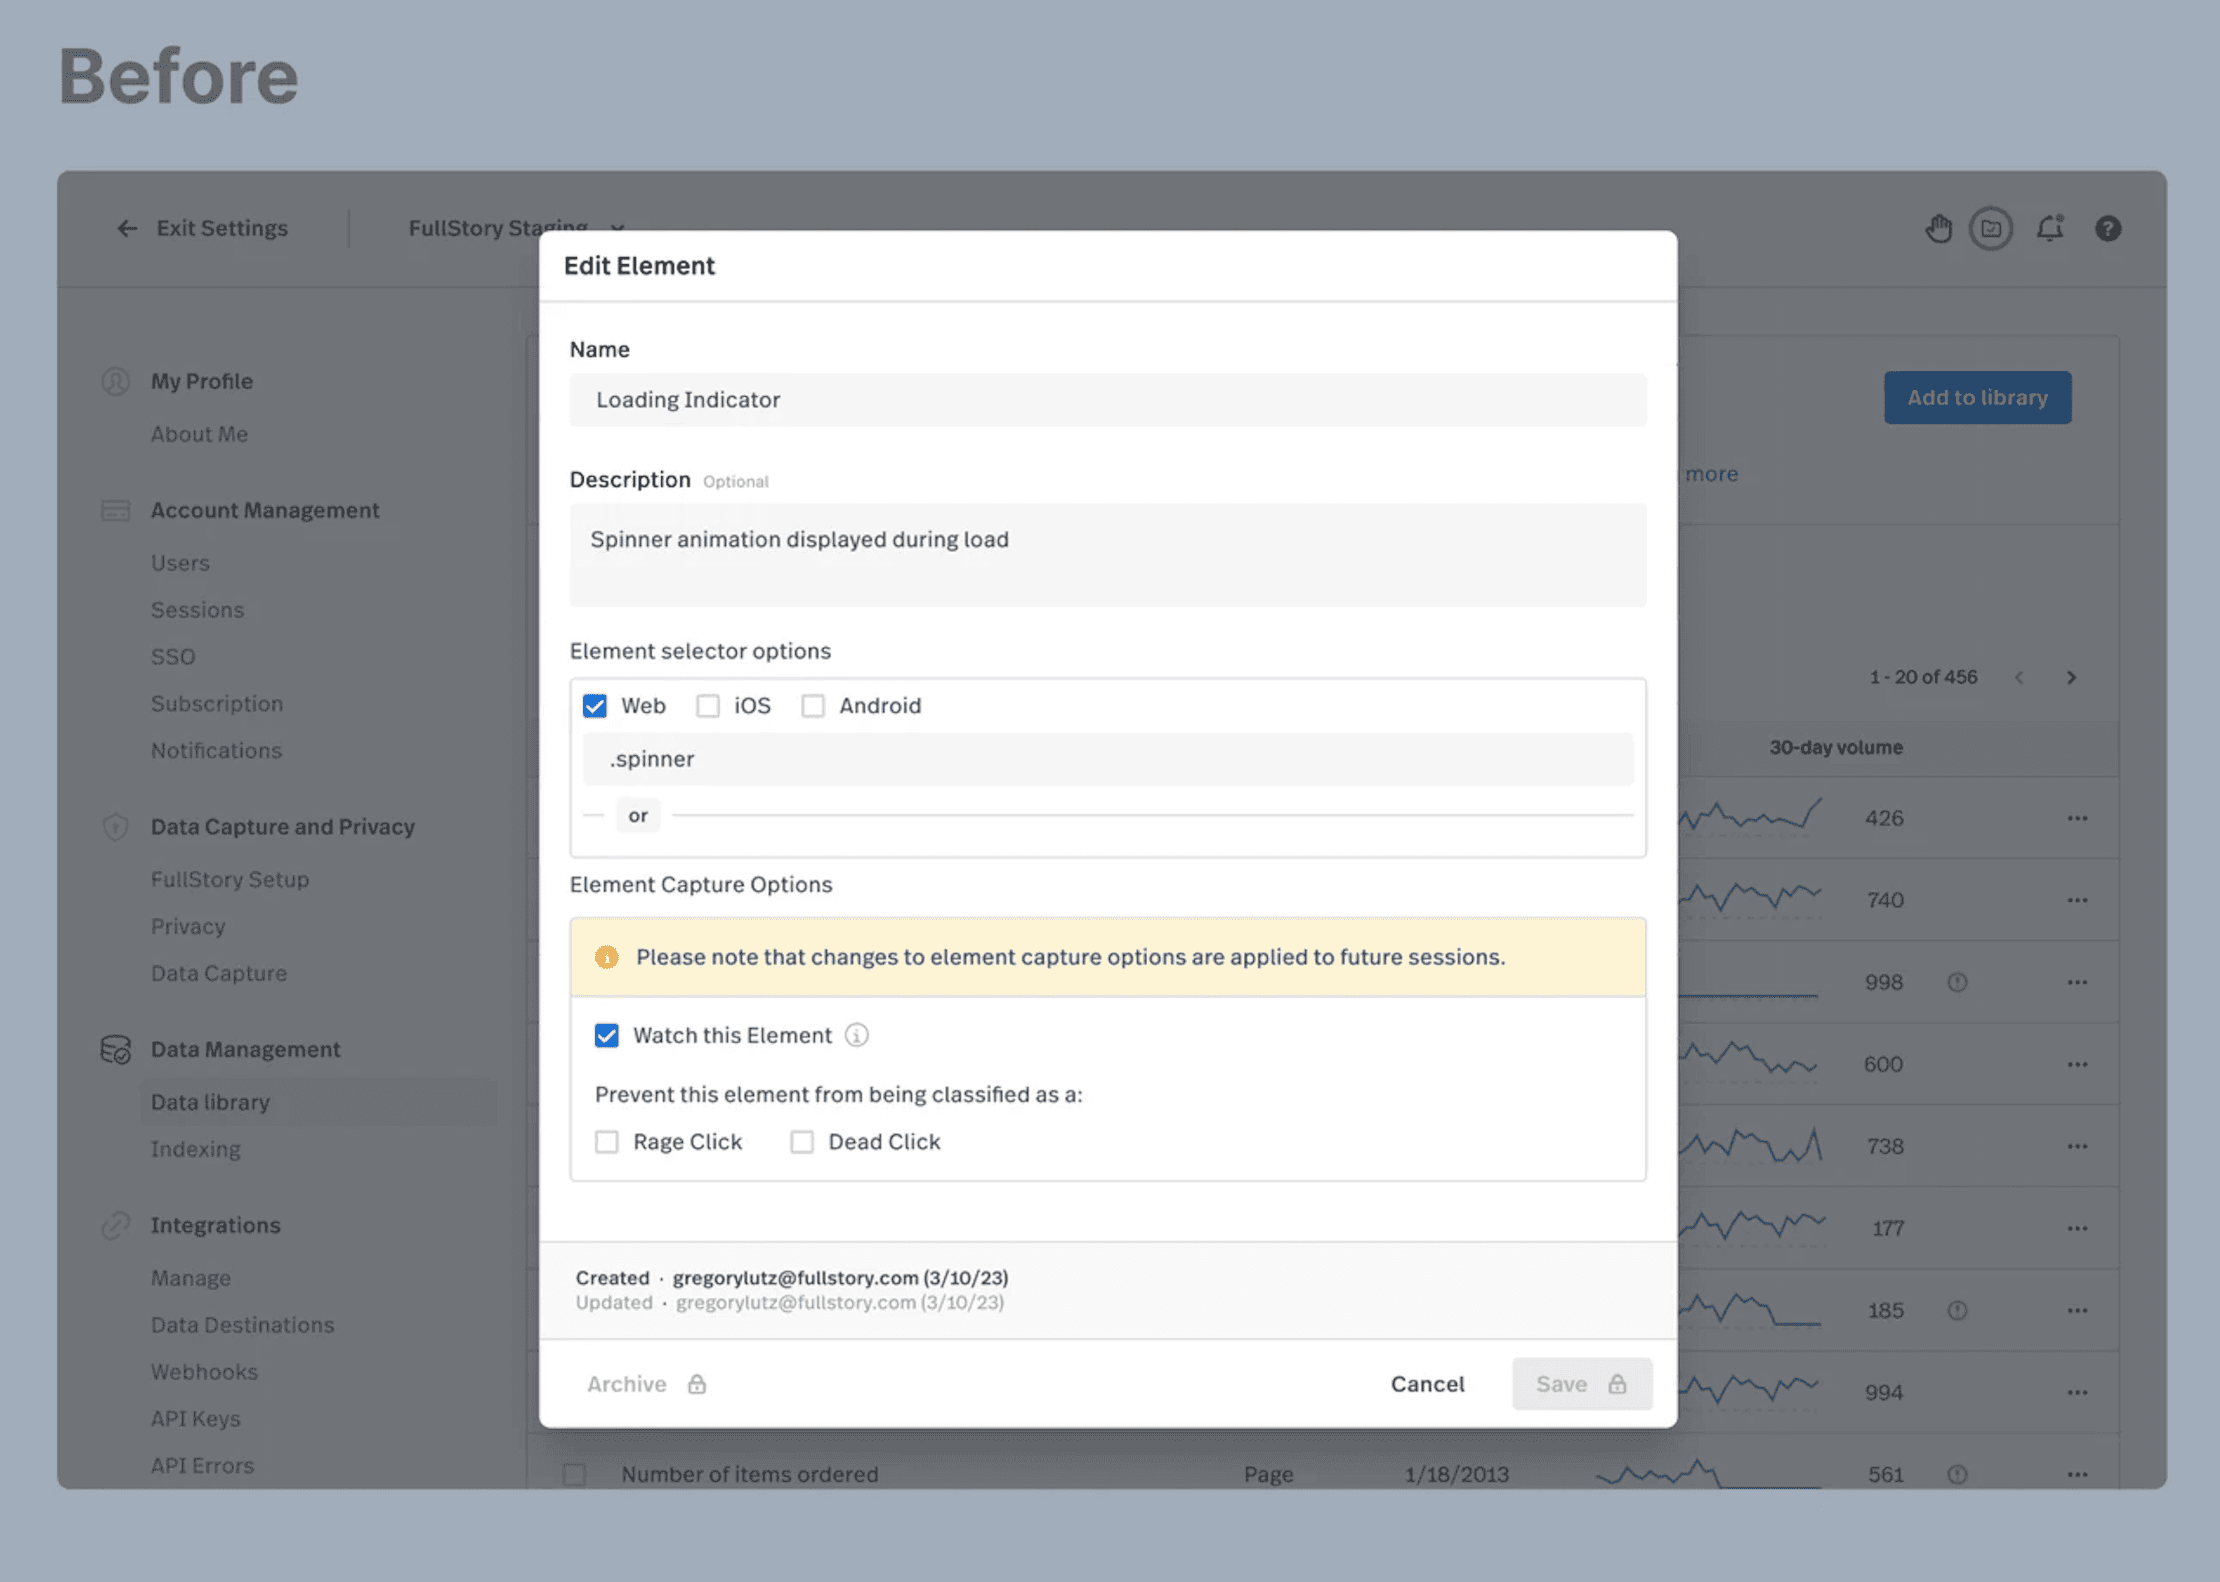
The before-and-after solutions are a result of a gradual progression, achieved through many small, frequent, reliable, and uncoupled releases. Bringing this solution to market has fulfilled our goal of increasing users' trust in the data that powers dashboards and metrics, while emphasizing our key differentiator of complete and automatically captured behavioral data.
Outcomes
Changes in the behavior we have achieved towards the goal of improving customers' data quality:
45% increase in archiving broken data objects
80% increase in total visits to the landing page of the updated experience
6.2x increase in engagement with data previews after 30-day event volume spark line was introduced in the modal
Within the first 30 days, the total percentage of broken data objects decreased by 9%, and some customers have completely fixed or archived broken data, resulting in a 100% reduction.
Customer feedback
Customer quotes during Alpha, Beta testing and after the feature got generally available: "it saves me so much time", "gives me visibility where we never had it before", "it is so easy", "without this experience we just wouldn't be able to audit and maintain data quality long-term".
Stakeholder feedback
Sales engineers and solution architects reported a reduction in time to build proof of concepts and manage data quality for selected customers, with some experiencing up to a 2x decrease.
Customer support reported that resolving new tickets became easier, often reducing the time to resolution and decreasing the dependency on engineering previously involved in troubleshooting.
Conclusion
The Data Quality Monitoring project presented significant complexity from both technical and usability perspectives, with much ambiguity surrounding its value and viability. Involving the brand-new team early in the product discovery journey enabled us to rapidly become domain and customer experts. Together, we got to the core of actual user needs and motivations, efficiently managed risks, and pivoted as soon as we uncovered new data and insights. Furthermore, by prioritizing data quality and context, we enhanced the overall data structure, creating valuable opportunities to leverage generative AI.
